
BMDLs
The BMDL
As already noted, a BMDL is a Benchmark Dose Level (BMDL), and it is not a HBGV. The question is now, what is it?
On first sight a BMDL is best to be compared with a NOAEL; it describes the dose causing an (adverse) effect that was observed in an experimental study. It should also demonstrate a dose-effect relationship; by increasing dose levels one must observe a proportional increase in the response. The next step is however different. Now one uses a mathematical curve fitting method to connect the different dose-response points. This is different from the traditional way where the points of the dose-response are just connected by straight lines.
The dose response curve
After curve fitting, one can use the curve to interpolate for doses that were not tested. Such interpolation is most interesting for finding the hypothetical dose where the response can be noticed for the first time, i.e. the threshold of the effect. The interpolated threshold level can be similar or close to the NOAEL (which is the real dose level derived from the study) but can be somewhat higher (between the NOAEL and LOAEL). So the curve fitting will provide a more precise threshold level than the NOAEL derived directly from the experimental data.
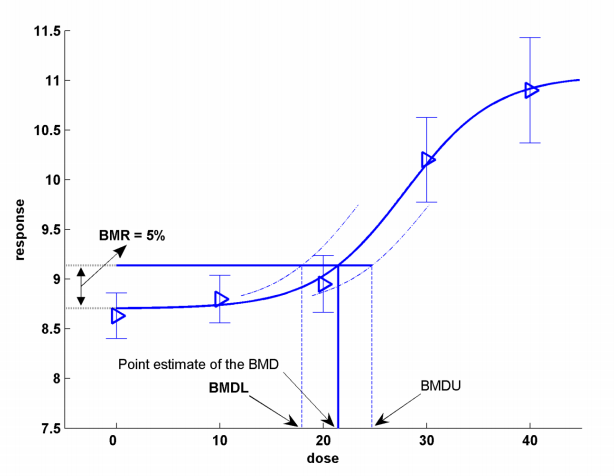
As a consequence of the mathematical curve fitting, the curve will always show an asymptotic bend at the lower doses. It will never show a true threshold dose. So the threshold dose has to be calculated for a certain response.
To calculate the lowest effect dose the following approach is used. First the minimal response above the asymptote is chosen. That can be an increase in 1, or 5, or 10%; leading to a BMDL01, or BMDL05, or BMDL10. Using the curve the corresponding dose level is now known. Next the 95th percentile describing the uncertainty of the curve is taken into account, and the BMDL (dose) is fixed at the lower end of the uncertainty boundary of the curve.
Software
At this moment there are two major computer tools for BMDL calculations. The first is PROAST; this is a software package that is developed by the by the Dutch National Institute for Public Health and the Environment (RIVM). There are two web applications of this package, one by EFSA and one by the RIVM. The RIVM provides also a package that is to be installed in the statistical software R.
The second BMDL application is the result of an effort of US-EPA and NIOSH. It is called BMDS and its source code can also be downloaded. For this one needs Microsoft Visual Studio.
Summary
BMDLs are the results of mathematical curve fitting of data from toxicologies studies. Because of this approach, the treshold levels of effects can be calculated more precise than the selection of a NOAEL. To calculate the BMDL one needs specific computer software that can be found at the Internet.
In contrast to setting a HBGV, setting a BMDL does not involve safety factors. And, as BMDLs can be derived for all dose response curves, one can have different BMDLs for one chemical. Besides one can have a BMDL10, and BMDL05, and BMDL01 for the same effect. It then needs additional toxicological experts to decide which BMDL is to be used in an exposure assessment as the permissible exposure limit value.