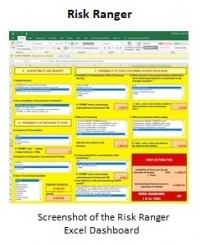
Risk Ranger tool
Risk Ranger calculates a (relative) risk ranking on the basis of a description of food contamination with pathogens. The "Risk Ranking" value is a simplified measure of relative risk of hazardous effects of microbiological agents, as can be read at the end of this page. It originates from the Australia's food safety information portal but today the site lacks references to it. To calculate the rank, a computer tool was developed. The tool is called "Risk Ranger: A Simple Food Safety Risk Calculation Tool".
The RiskRanger tool is compared by EFSA with different other tools for a similar type of assessment. The results of that evaluation are published in a Scientific Opinion of 2014. It shows that the relative ranking of (simulated) cases of a microbiological contamination of some foodstuffs as calculated by the different tools is quite similar, so it can be concluded that RiskRanger is fit for purpose.
Risk Ranger online
 The original tool is implemented in a (Microsoft Excel) spreadsheet that can be downloaded from the Internet for free. This spreadsheet is however to be controlled by macros, which are nowadays being considered unsafe and therefore mostly locked. Unlocking can be quite tedious. It was therefore decided to provide this portal with an online tool that fully mimics the spreadsheet, leading to results identical to the spreadsheet. The name of the online tool is kept "Risk Ranger".
Start
To use the online version of Risk Ranger,
select its icon
Risk Ranking
To explain the approach that is being used by RiskRanger, the following text was taken from the spreadsheet:
Because of the magnitude of differences in risk under situations and scenarios of interest a logarithmic scale is used and, for convenience, a scale between 0 and 100 was chosen.
We set the upper limit of the scale (100) as the worst imaginable scenario, i.e. where every member of the population eats a meal that contains a lethal dose of the hazard every day.
To set the lower end of the scale we arbitrarily chose a probability of mild food-borne illness of less than or equal to one case per 10 billion people (greater than current global population) per 100 years as a negligible risk. The ‘risk’ in this situation is 2.75 x 10⁻¹⁸ times that of the scenario to which the upper end of the scale corresponds.
Thus, the chosen range extends over 17.56 orders of magnitude and, as a result, an increment of six "Risk Ranking units", corresponds approximately to a factor of 10 difference in the absolute risk estimate.
